Open beta
Stop reacting to crises
Reveal the critical dependencies behind your operations
and anticipate the consequences of global events
before they affect your business.
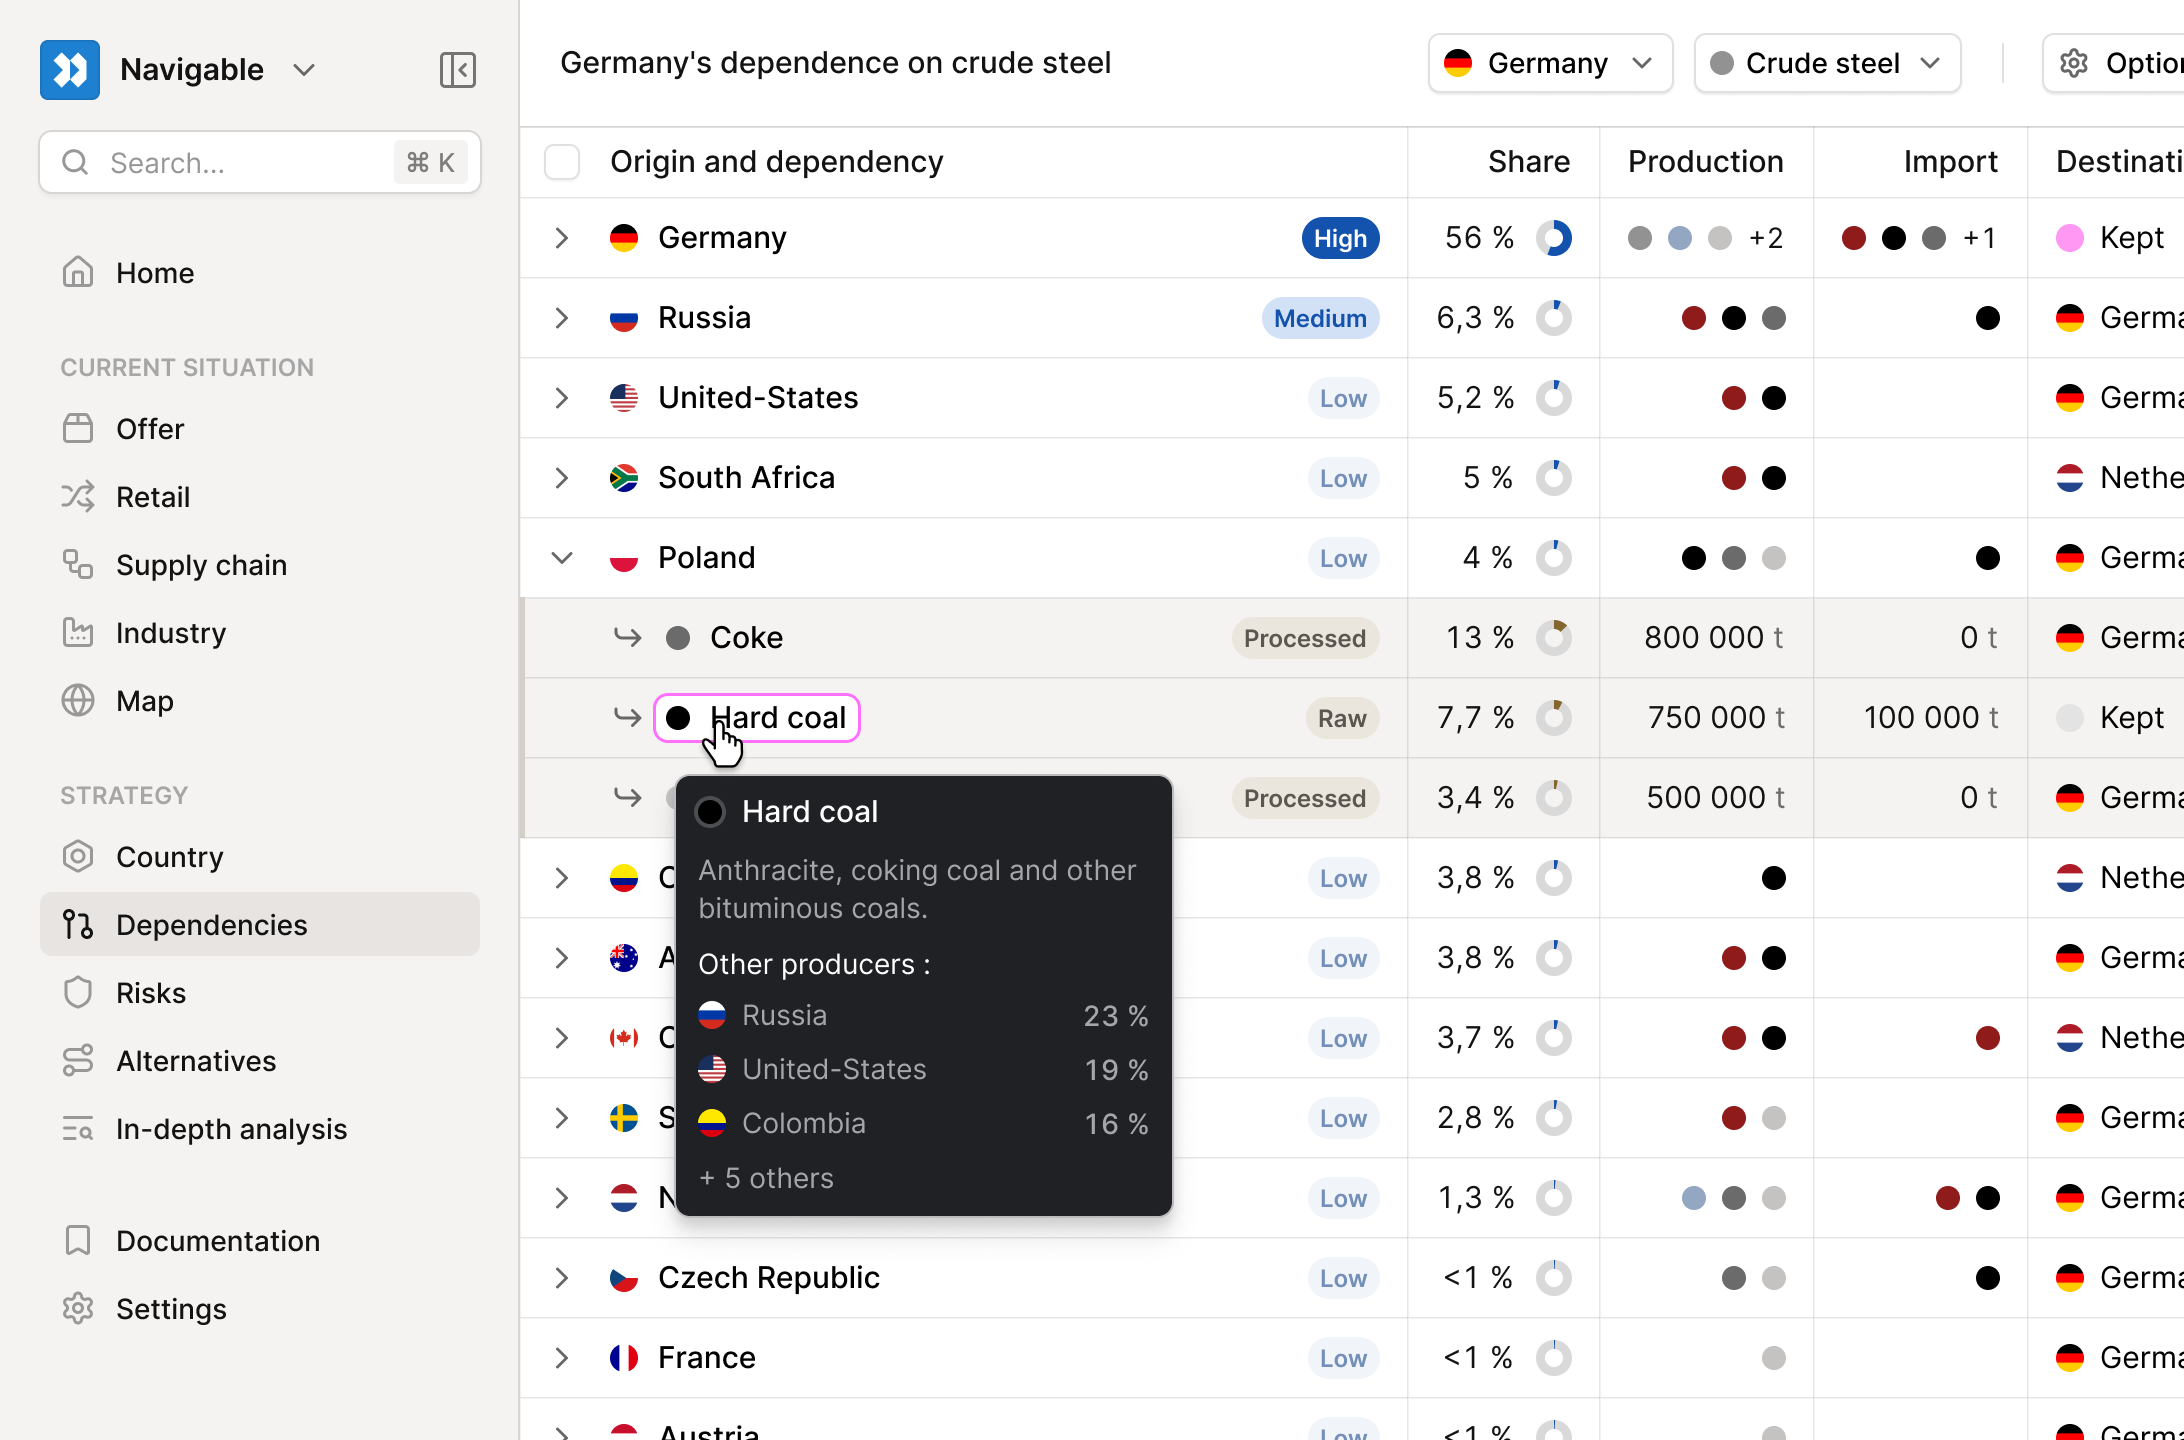
Reveal the hidden dependencies of your operations
Map global value chains from natural resources to finished products
to identify precisely what your operations truly depend on.

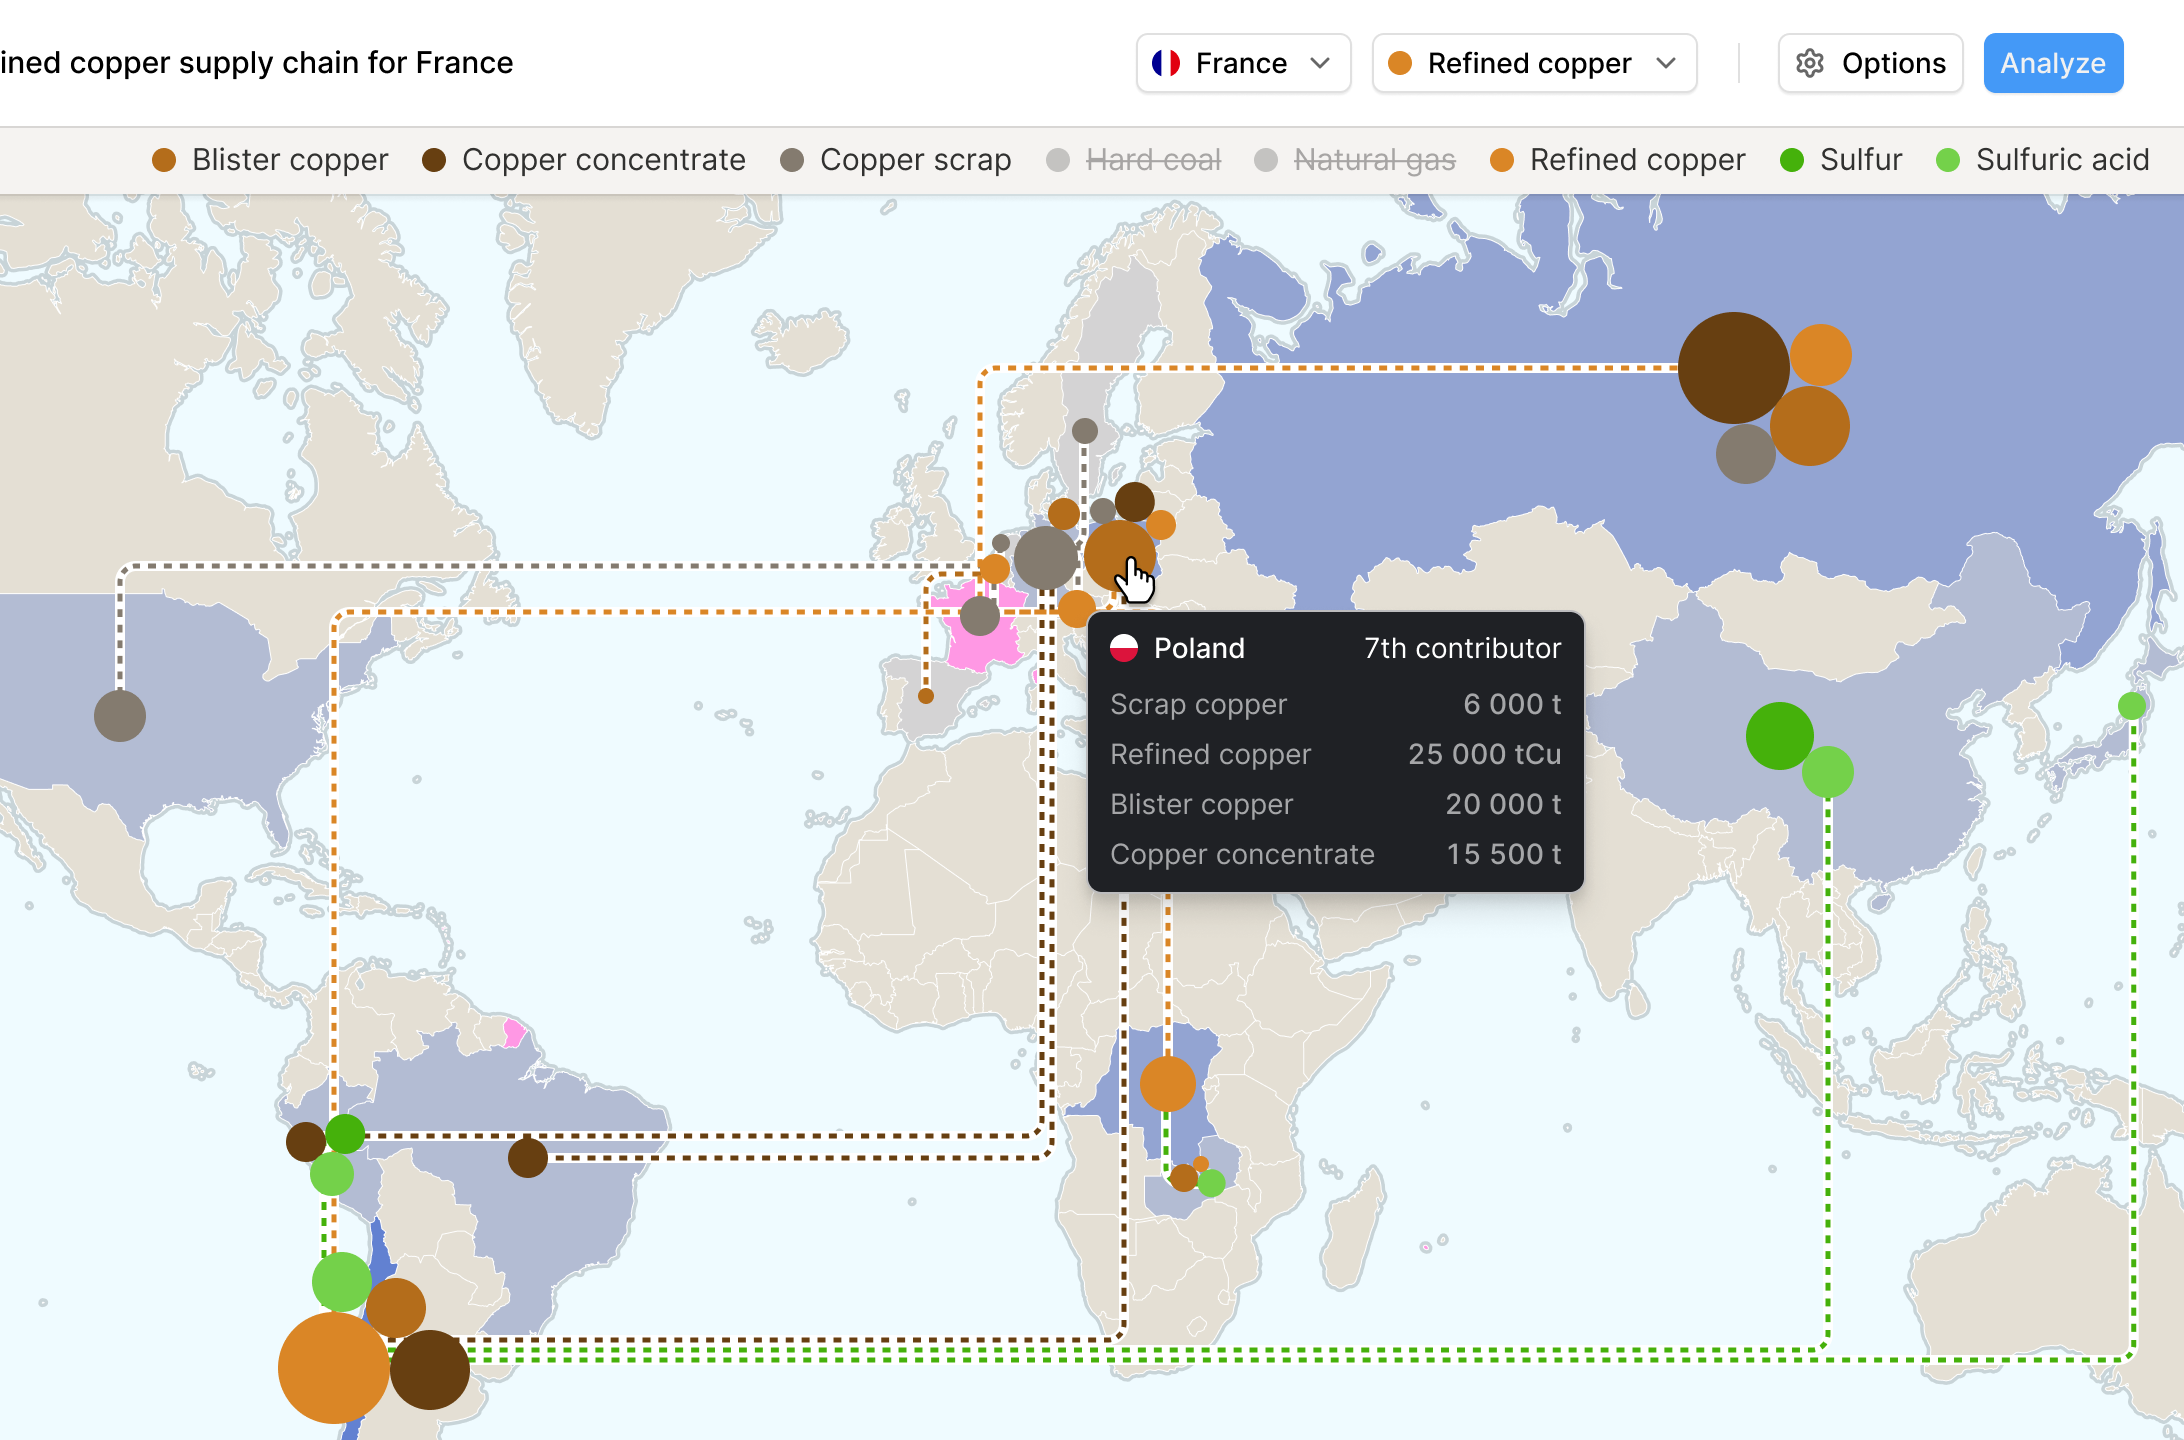
Materials and energy
Visualize resource volumes and energy requirements at each transformation stage.
Tier-N depth
Identify critical intermediaries and key countries hidden upstream of your direct suppliers.
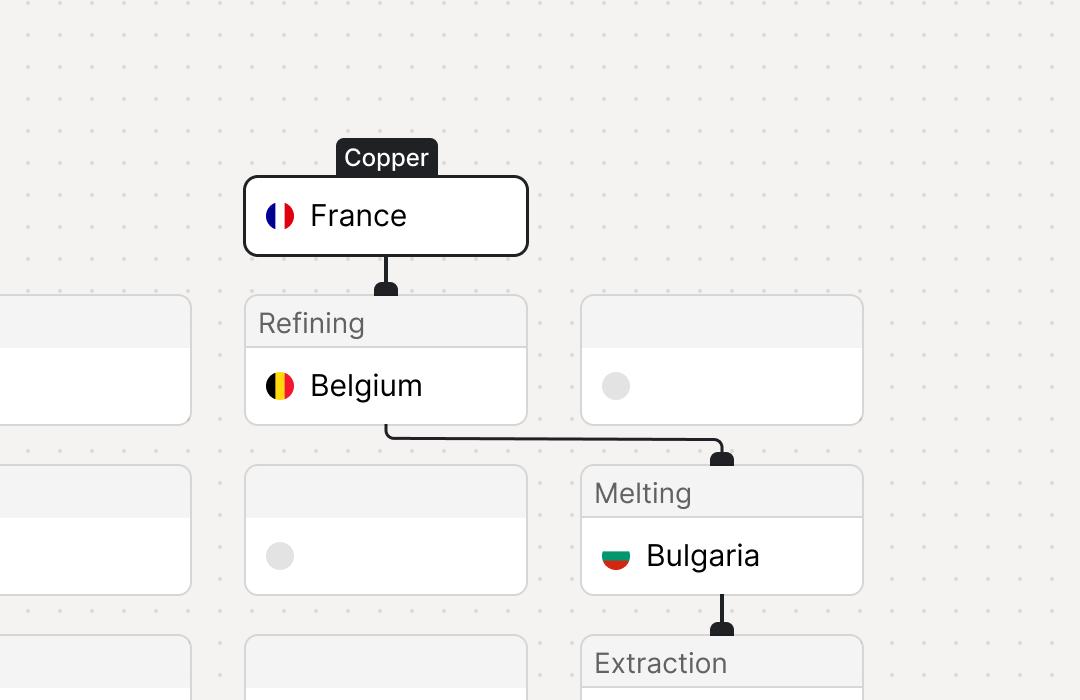
From product to resource
Trace the macroeconomic path linking a finished product to all of its raw materials.
Detect early signals of industrial shocks
Continuously detect changes in production capacity, trade flows,
and geopolitical constraints, then assess their cascading effects across global value chains.

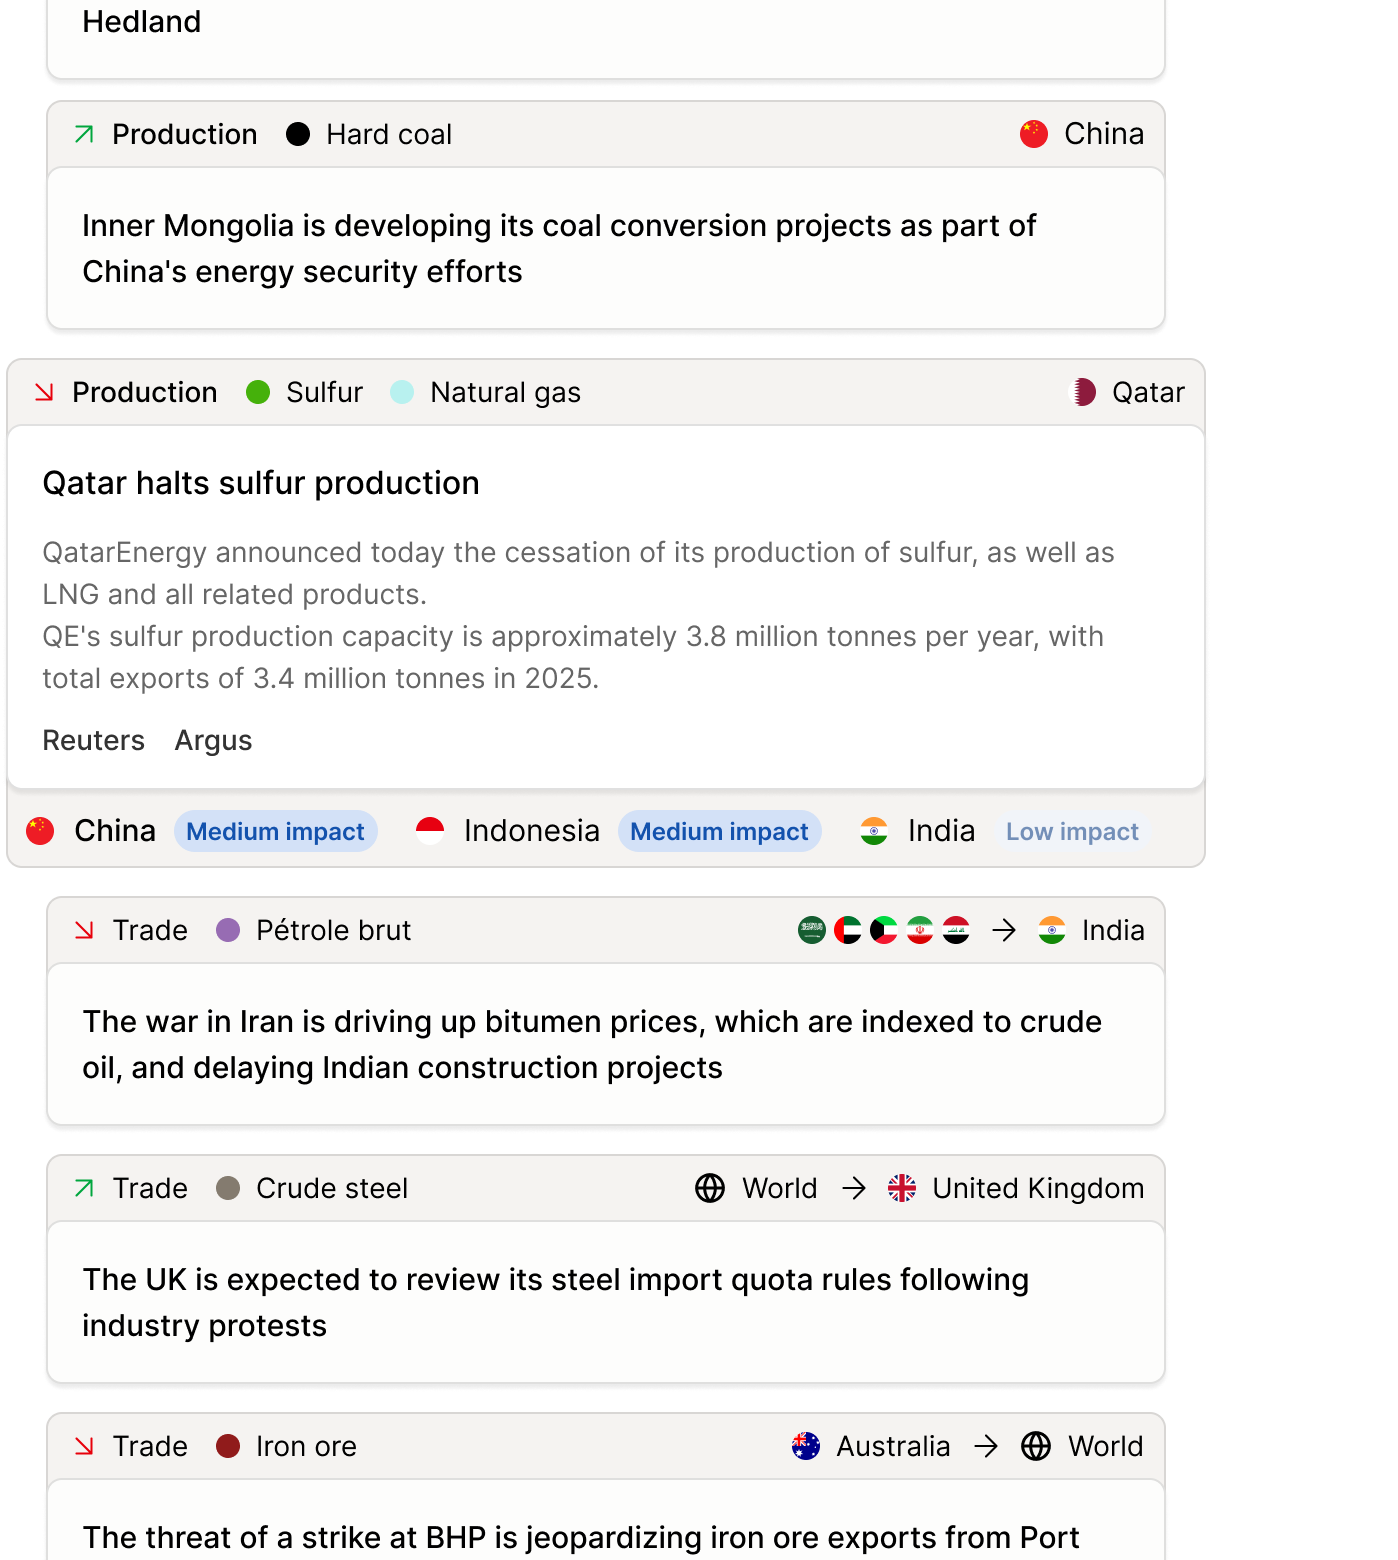
Live
Event detection
Real-time identification of events affecting critical materials and industries.
Continuous coverage
New production capacity, plant shutdowns, trade policies, conflicts, natural disasters, and more.
Recontextualization
Put detected events into value-chain context to anticipate long-term shocks.
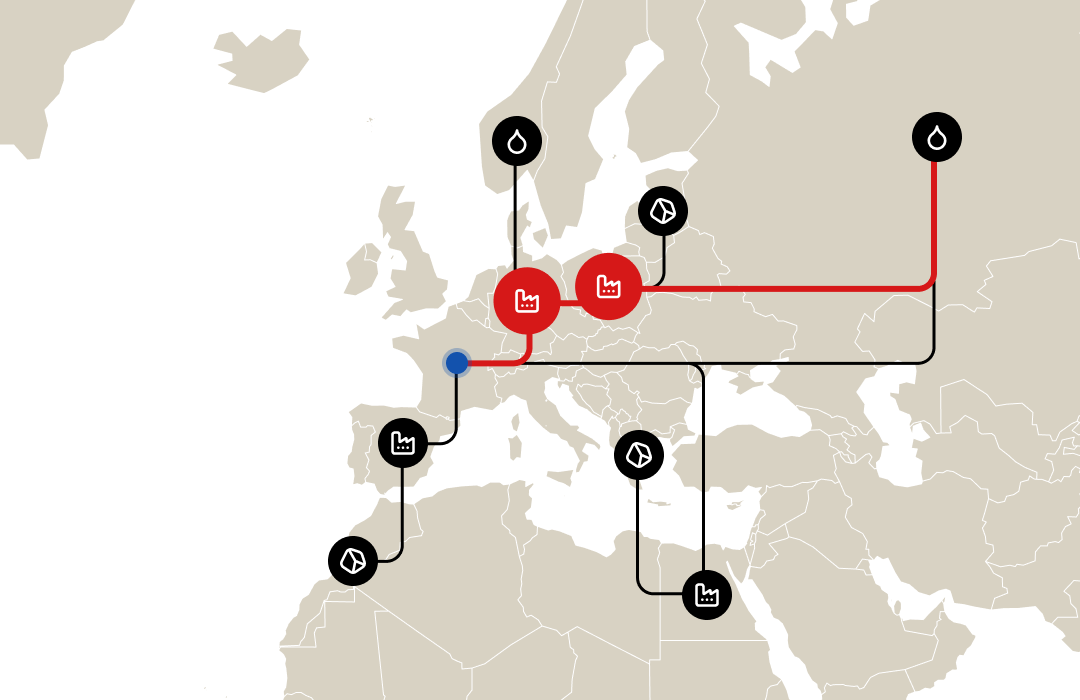
Evaluate your exposure to global disruptions
Simulate embargoes, logistics failures, production shutdowns
and trade restrictions to quantify vulnerabilities across your value chain.

Consequences of shocks
Simulate systemic disruptions and measure lead time before real impact on a sector or country.
Supply alternatives
Identify available global production capacities to reallocate flows realistically during a crisis.
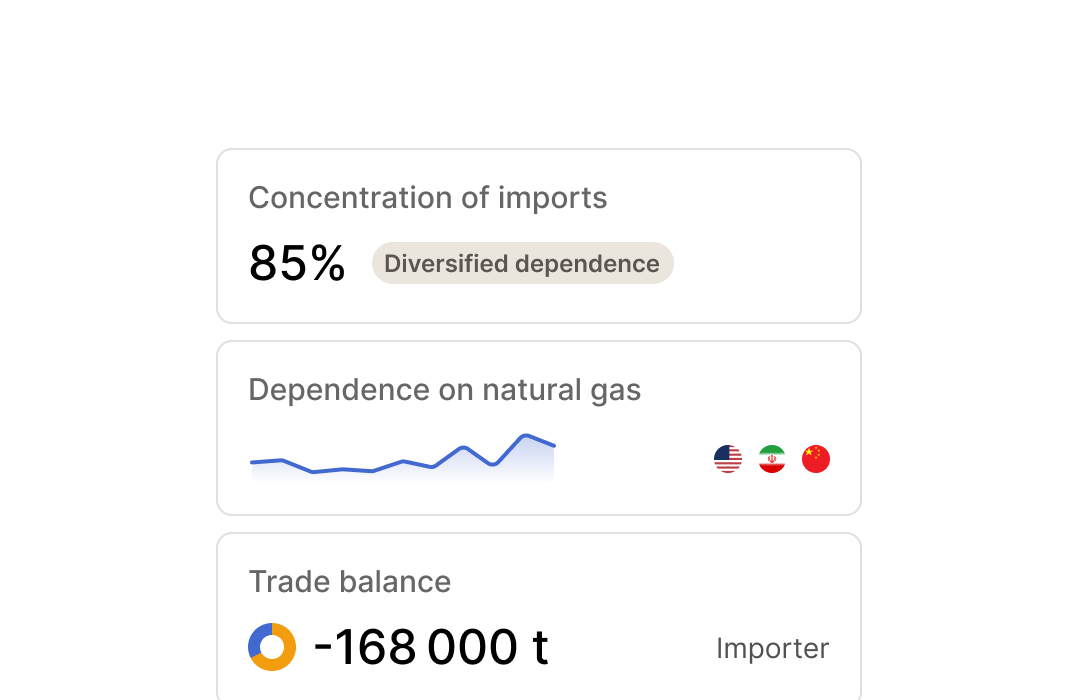
Vulnerability indicators
Assess your vulnerability with standardized metrics based on real physical balances and infrastructure exposure.
Anticipate future industrial power shifts
Compare extraction, processing and self-sufficiency capabilities across major economic blocs to identify long-term risks and opportunities.

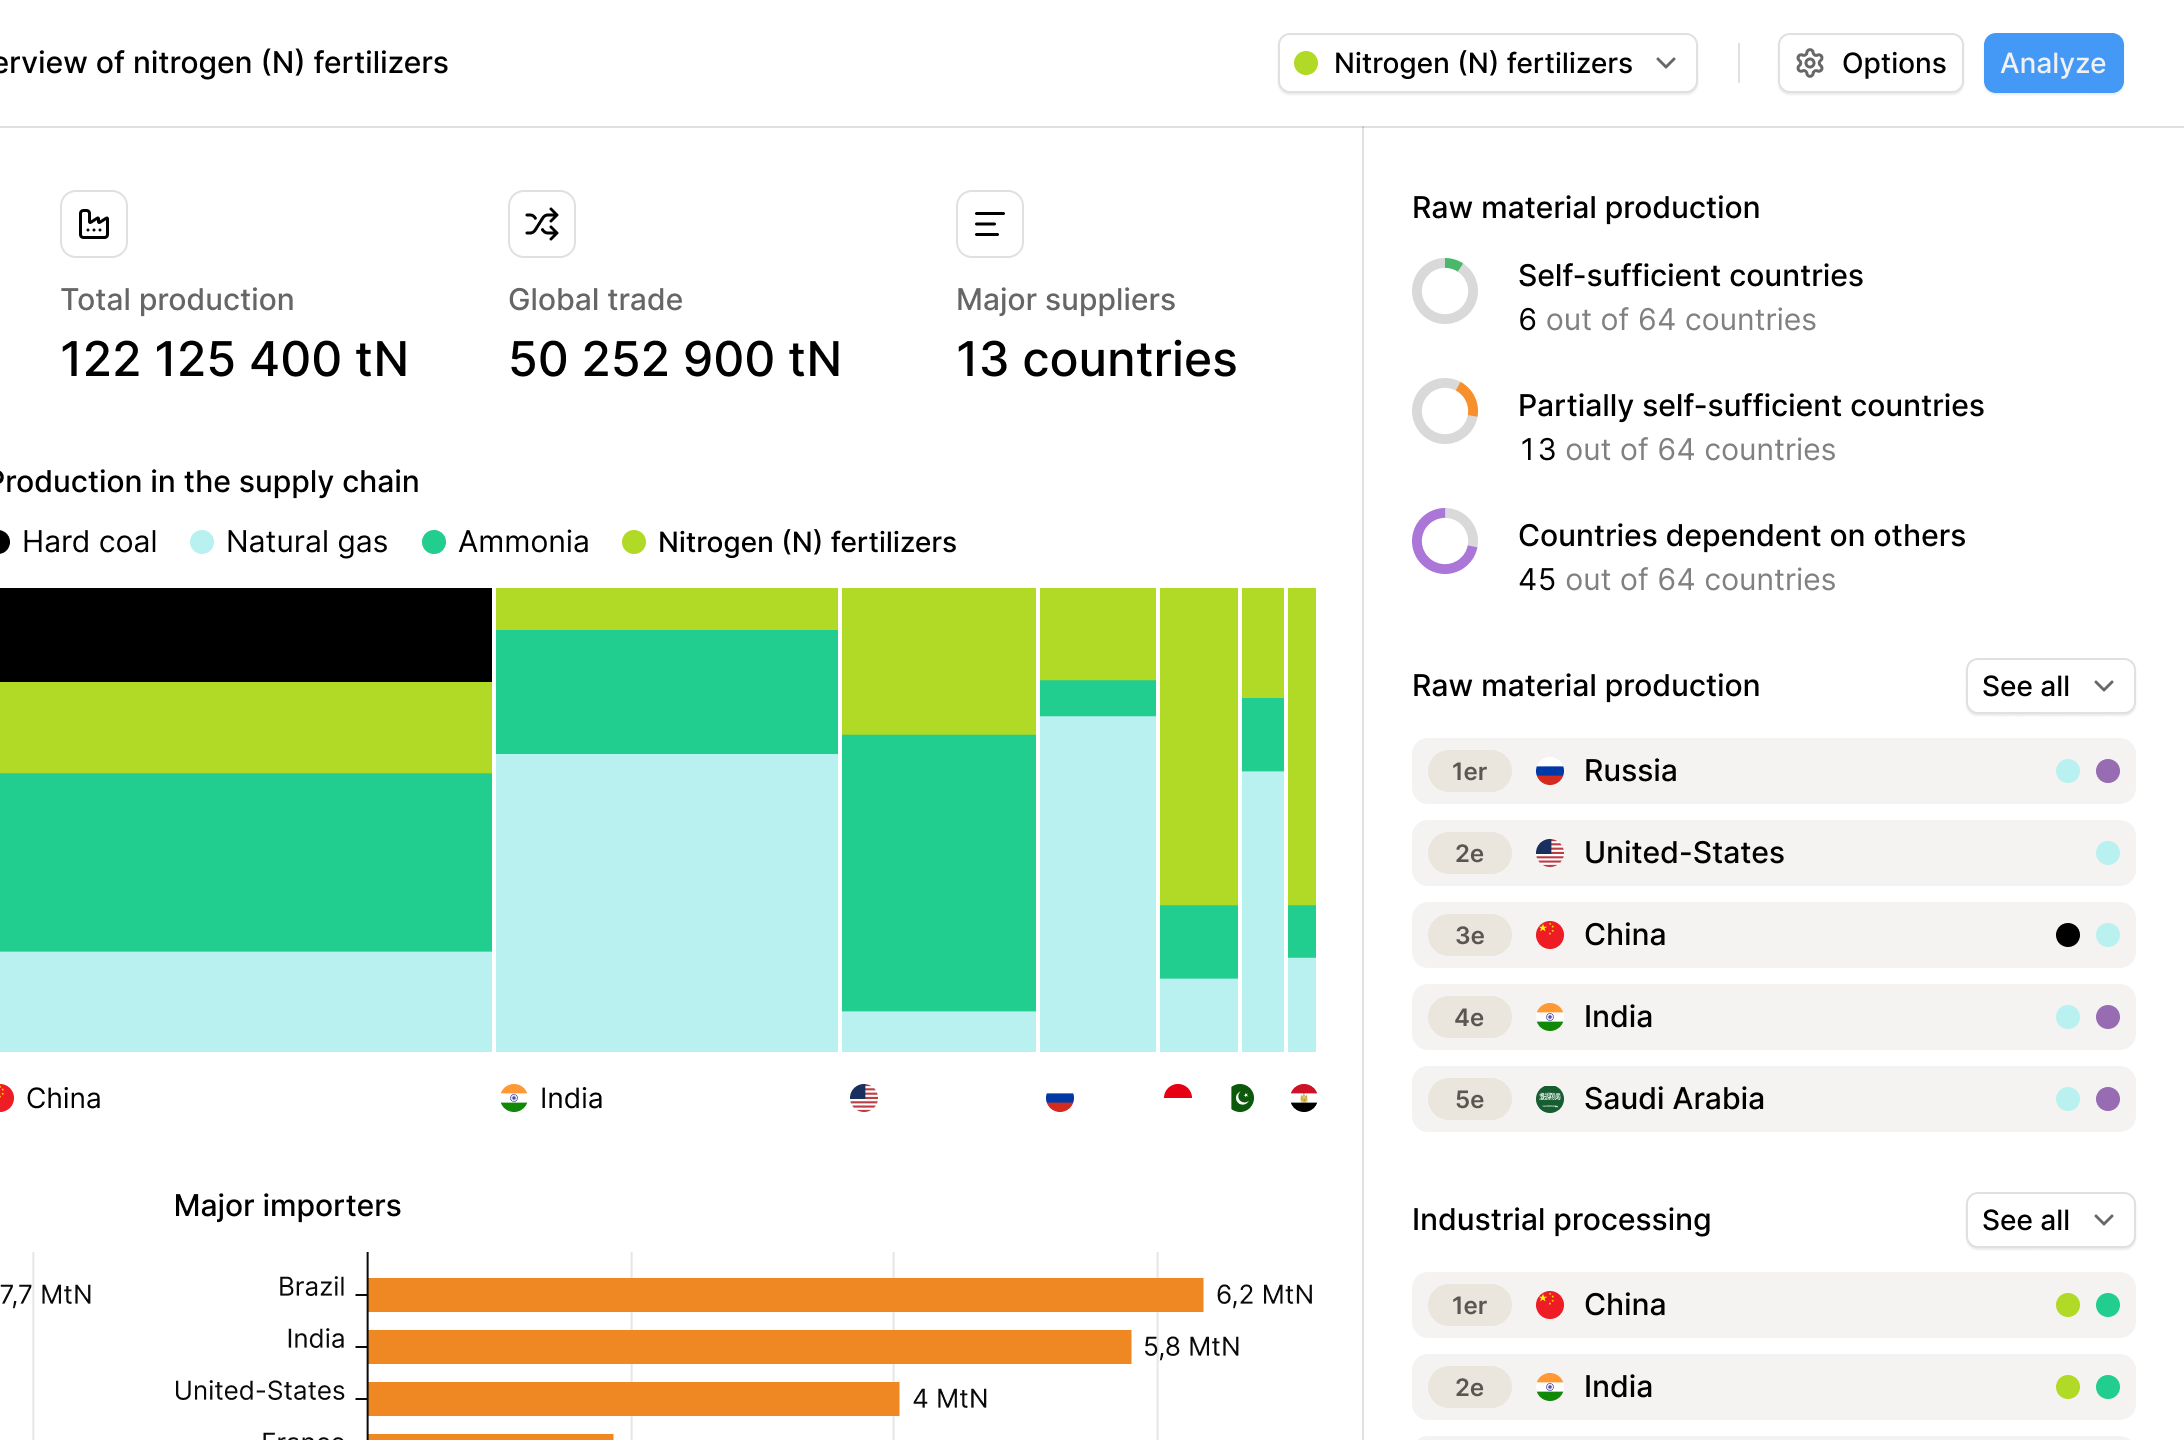
Macro-industrial coverage
Access import-export flows consolidated and reconciled across more than 150 countries for a globally consistent view.
Transformation processes
Track major industrial capacities and flows by local transformation processes.

MCP connection for your AI
Query the platform directly from your AI tools through an MCP connection, and integrate our data into your own analyses.
Frequently asked questions
Technical answers for the requirements of public planners, investors, and federations.
Let's assess the resilience of your strategic priorities
Share your details to schedule a demo, discuss a partnership, or request information about our solutions.
Your details are used only to respond to your request. We do not share your data with third parties and do not send marketing communications. This form is protected by Cloudflare Turnstile.